Conversion rate optimization (CRO) is the practice of increasing the share of visitors or users who complete a desired action, using measurement and controlled testing rather than guesswork. The "conversion" can be any defined goal: a purchase, a signup, a trial start, or a free-to-paid upgrade. This page defines the term, shows how the conversion rate is calculated, explains the main testing and research methods in some depth, and describes how CRO applies to free-trial and freemium software.
A conversion rate is the number of completed goal actions divided by the number of people (or visits) that had the opportunity to complete them, expressed as a percentage:
(Conversions ÷ visitors or sessions) × 100
For example, 40 signups from 2,000 visitors is a 2% conversion rate. Two details matter more than the arithmetic suggests.
The denominator changes the number. A session-based rate divides by visits; a visitor-based (or user-based) rate divides by unique people. Because one person often visits several times before converting, the session-based rate for the same site is usually lower than the visitor-based rate. Neither is wrong, but they are not comparable to each other, so a team has to pick one definition and hold it constant. Analytics platforms differ in their defaults, which is a common source of mismatched numbers between tools.
Micro versus macro conversions. A macro conversion is the primary business goal: the purchase, the paid subscription. Micro conversions are the smaller committed steps on the way there: viewing a pricing page, adding to cart, creating an account, inviting a teammate. Micro conversions are useful because they occur more often (so tests reach conclusions faster) and because they show where intent builds or dies. The risk is optimizing a micro conversion at the expense of the macro one, for example driving more trial signups of lower quality, so micro-conversion tests are normally checked against downstream metrics before a change is declared a win.
CRO grew out of two developments in the 2000s. First, web analytics matured to the point where user behavior could be measured at scale rather than sampled or guessed. Second, testing tools made it practical to run controlled experiments against live traffic: Google released a free website testing product in 2007, and a wave of dedicated experimentation platforms followed around 2010, putting A/B testing within reach of teams without in-house statisticians. Large technology companies had already normalized the practice internally; researchers at Microsoft published influential practical guides to running controlled experiments on the web in the late 2000s (Kohavi et al., 2009). The underlying statistics are much older, going back to randomized controlled experiments in agriculture and medicine in the early twentieth century. What changed was the cost: on the web, assigning users to versions at random and counting outcomes became nearly free, so "redesign by opinion" could be replaced by "form a hypothesis, test it, keep the change only if the data supports it."
A/B testing (also called split testing) is the core method of CRO. Its logic is simple but the details determine whether the result can be trusted.
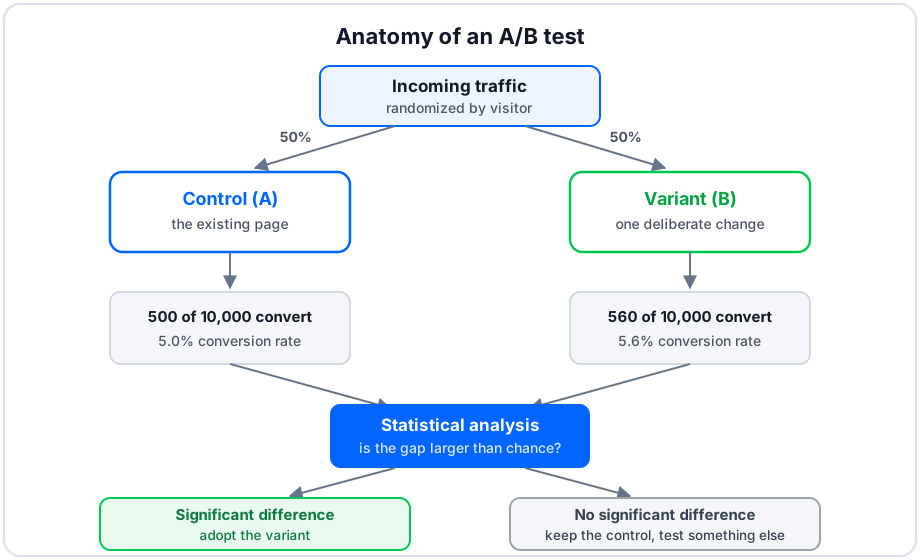
The anatomy of an A/B test: random assignment, parallel measurement, and a statistical decision. The numbers shown are illustrative.
Control and variant. The existing experience is the control (A). The variant (B) contains one deliberate change: a different headline, form, price presentation, or flow. Both run at the same time against comparable traffic, which removes the effect of seasonality, campaigns, and news cycles that would contaminate a before-and-after comparison.
The randomization unit. Users are assigned to A or B at random, and the choice of what gets randomized matters. Randomizing by visitor (usually via a persistent identifier) means a returning user always sees the same version, which keeps the experience consistent and the measurement clean. Randomizing by session or pageview can show the same person both versions, which muddies the data. For B2B products, randomizing by account or company is sometimes more appropriate than by individual user, since colleagues influence each other.
Sample size intuition. Small samples produce noisy rates. If 10 visitors see each version, a single extra conversion swings the measured rate by 10 percentage points; if 10,000 see each version, the same event moves it by 0.01 points. Detecting a small real difference therefore requires a large sample, and the required sample grows quickly as the effect being hunted gets smaller. This is why low-traffic pages often cannot support fine-grained testing at all.
Statistical significance and p-values, plainly. Even two identical pages will show slightly different conversion rates by chance. A significance test asks: if the two versions were truly identical, how often would a gap at least this large appear anyway? That probability is the p-value. A small p-value (0.05, or 5%, is the common threshold) means the observed gap would be rare under pure chance, so the difference is treated as real. A p-value is not the probability that the variant is better, and "not significant" does not prove the versions are equal; it means the test did not gather enough evidence to distinguish them.
Statistical power and minimum detectable effect. Power is the probability that a test will detect a real difference of a given size if one exists. A test with low power will usually miss real improvements, report "no significant difference," and quietly discard good ideas. The minimum detectable effect (MDE) is the smallest lift a test is designed to catch; choosing it before the test starts, based on available traffic and how long the team is willing to run the experiment, is what makes a sample-size calculation possible. A common convention borrowed from experimental science is to aim for 80% power at the chosen MDE.
Why peeking inflates false positives. Checking results daily and stopping the moment a variant crosses the significance threshold sounds efficient, but it breaks the statistics. The 5% false-positive guarantee holds for a single look at a predetermined sample size. Looking many times gives chance many opportunities to produce a temporary spurious "win," so the real false-positive rate can climb far above 5%. The remedies are to fix the sample size (or duration) in advance and evaluate once, or to use sequential testing methods that are explicitly designed to be checked continuously.
Frequentist testing. The classical approach described above is frequentist: it fixes a decision rule in advance (threshold, sample size) and controls the long-run rate of false positives across many experiments. Its outputs are p-values and confidence intervals. Its strengths are well-understood guarantees and simple planning; its common criticisms are that p-values are widely misread and that the fixed-horizon requirement fits awkwardly with the temptation to monitor results live.
Bayesian testing. The Bayesian approach instead computes, given the data observed so far, a probability distribution over how good each version actually is, and reports statements such as "there is a 92% probability that B beats A." Many commercial testing tools adopted this framing because the outputs are easier to interpret and results can be monitored continuously with fewer distortions. Its common criticisms are that conclusions depend partly on modeling choices (the prior), and that intuitive-sounding probabilities can create overconfidence if the underlying assumptions are off. Both approaches, run carefully, tend to reach similar conclusions on well-powered tests; neither rescues a test with too little traffic.
Multivariate testing (MVT) varies several elements at once (for example three headlines × two images × two buttons, giving twelve combinations) to learn which combination performs best and whether elements interact. Because traffic is split across every combination, MVT needs far more volume than an A/B test to reach a reliable answer, which restricts it in practice to high-traffic pages.
Multi-armed bandit testing takes a different stance on the explore-versus-exploit tradeoff. Instead of splitting traffic evenly until a test concludes, a bandit algorithm gradually shifts more traffic toward whichever version is currently performing better, reducing the cost of showing users an inferior version. Bandits suit situations where minimizing regret matters more than certainty: short-lived promotions, headline rotation, or picking among many options quickly. Classical A/B tests remain preferred when the goal is a clean, quantified causal answer that will inform decisions beyond the immediate page.
A funnel is the ordered sequence of steps toward conversion. Funnel analysis measures how many users pass each step so that effort concentrates on the leakiest one rather than being spread evenly.
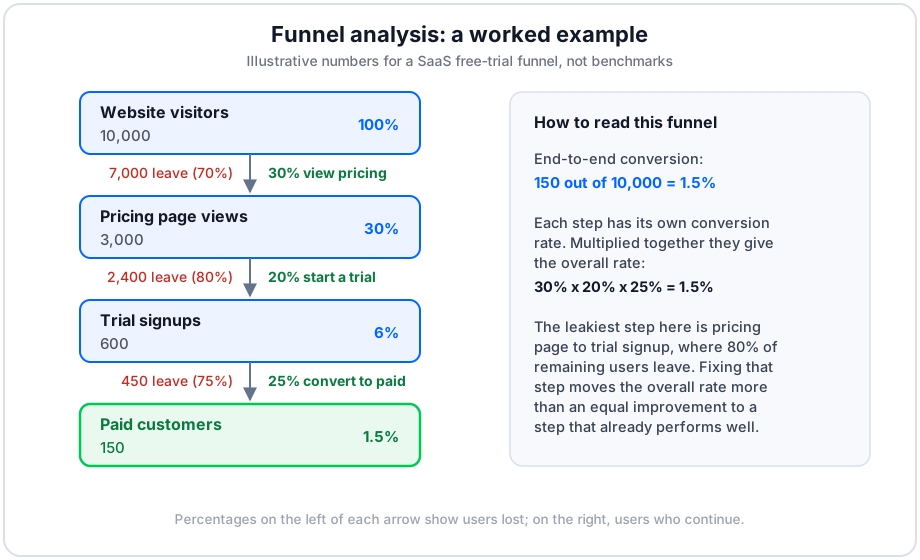
A worked funnel with illustrative numbers. Step rates multiply: 30% × 20% × 25% = 1.5% end to end.
Consider an illustrative SaaS funnel (these numbers are invented for the example, not benchmarks): 10,000 visitors, of whom 3,000 view the pricing page (30%), 600 start a trial (20% of pricing viewers), and 150 become paying customers (25% of trialists). The end-to-end conversion rate is 150 ÷ 10,000 = 1.5%, and it equals the product of the step rates. Two properties follow. First, improving any single step lifts the whole funnel proportionally: raising trial-to-paid from 25% to 30% takes paid customers from 150 to 180 with no extra traffic. Second, the step with the most absolute leakage (here, pricing page to trial, where 80% of remaining users leave) is usually where a fixed amount of testing effort buys the most, though a step with heavy leakage may also simply reflect low intent rather than a fixable flaw. Funnel data says where users leave; it never says why.
Quantitative data locates problems; qualitative methods explain them and generate the hypotheses that tests then evaluate.
- Session replay records anonymized reconstructions of individual visits, exposing hesitation, backtracking, rage clicks, and abandoned forms that aggregate metrics hide.
- Heatmaps aggregate clicks, taps, and scroll depth across many visits, showing what users notice, what they ignore, and how far down a page they actually get.
- Surveys and polls ask users directly, either on-page ("What almost stopped you from signing up today?") or after the fact. Exit surveys on cancellation and non-conversion are a standard source of hypotheses.
- Usability testing observes a handful of people attempting real tasks while thinking aloud. Published usability research (Nielsen Norman Group among others) has long argued that a small number of moderated sessions surfaces a large share of serious usability problems, which makes this method unusually cheap relative to what it finds.
The output of all four is the same: a specific, falsifiable hypothesis ("users abandon the signup form because the credit-card field appears before the product is explained") that a controlled test can confirm or refute.
Most teams generate more test ideas than traffic can support, so ideas are ranked. Two widely referenced scoring frameworks are ICE (score each idea for Impact, Confidence, and Ease, then rank by the combined score) and PIE (Potential, Importance, Ease). Both are heuristics rather than science: the scores are subjective, and their value is mainly in forcing explicit comparison and preventing the loudest idea from automatically going first. Traffic-weighted variants add a simple rule of thumb: pages with more volume and more leakage can support and justify more testing.
For software sold on a free trial or a freemium plan, the most valuable conversion is usually not the initial signup but the move from free to paid. The same experimental methods apply, but the levers are specific to the trial experience.
Activation and time-to-value. Activation is the moment a new user first experiences the product's core value: the first report generated, the first message sent, the first integration connected. Users who reach that moment convert at a much higher rate than those who never do, so trial CRO concentrates on shortening time-to-value: fewer setup steps, sensible defaults, sample data, and onboarding that routes users to the activating action instead of touring every feature. Instrumenting activation as an explicit micro conversion is usually the first step.
Opt-in versus opt-out trials. An opt-in trial requires no payment method up front; an opt-out trial collects a card and charges automatically unless the user cancels. The tradeoff is well documented in industry practice: opt-in trials generate more signups but convert a smaller share of them, while opt-out trials suppress signups but convert far more of those who do enter, partly through inertia. Which produces more paying customers, and more satisfied paying customers, depends on the product and audience, which makes the choice itself a legitimate subject for experimentation. Opt-out trials also carry regulatory and reputational obligations around clear disclosure and easy cancellation.
Payment pre-authorization. Between the two poles sits pre-authorization: validating a payment method (sometimes with a temporary hold) without charging it. This filters out low-intent signups and confirms the card works before the billing date, while avoiding a surprise charge. Testing where in the trial the payment step appears, and how it is framed, is a common high-leverage experiment.
Dunning and involuntary churn. A meaningful share of failed conversions and cancellations are involuntary: the card expired, the charge was declined, the bank flagged the transaction. Dunning is the process of retrying failed payments on a schedule and notifying the customer to update their details. Because these users already chose to pay, recovering them is typically far cheaper than acquiring replacements, and payment recovery is properly counted as part of conversion optimization rather than as an unrelated billing chore.
- Testing without enough traffic. A page with a few hundred visits a month cannot detect modest improvements in any reasonable time. Low-traffic teams get more from qualitative research, larger and bolder changes, and micro-conversion metrics than from formal A/B tests of small tweaks.
- Optimizing a local maximum. Iterating endlessly on button colors within a weak page design polishes a local peak while a fundamentally better layout goes untried. Periodic radical redesign tests guard against this.
- Ignoring statistical validity. Peeking and early stopping, running tests during unrepresentative periods (launches, sales, holidays), and declaring winners from underpowered tests all produce "improvements" that evaporate after rollout.
- One-metric myopia. A change that lifts signups can degrade activation, revenue, or support load. Serious experimentation tracks guardrail metrics alongside the target metric.
- Sample pollution. Bots, internal traffic, users who clear cookies and get reassigned, and mid-test changes to the page all contaminate the sample. So does re-testing the same users across overlapping experiments without accounting for it.
Published industry studies commonly place average landing-page and e-commerce conversion rates in the low single digits; one widely cited WordStream analysis of advertiser accounts (2014) reported a median landing-page conversion rate of roughly 2.35%, with the top tier of pages converting several times higher. Trial-to-paid rates in SaaS vary even more, differing by an order of magnitude across pricing models, audiences, and trial designs. Benchmarks are best used to sanity-check instrumentation, not as targets: a site's own historical rate, definition of conversion, and traffic mix make cross-company comparison unreliable.
Most CRO work follows a loop rather than a checklist: research current behavior with quantitative and qualitative tools, form a specific hypothesis, run a controlled test sized to answer it, measure the result honestly, and record what was learned whether the variant won or lost. Losing tests are not waste; they are documented knowledge about what this audience does not respond to, and they feed the next round of research.
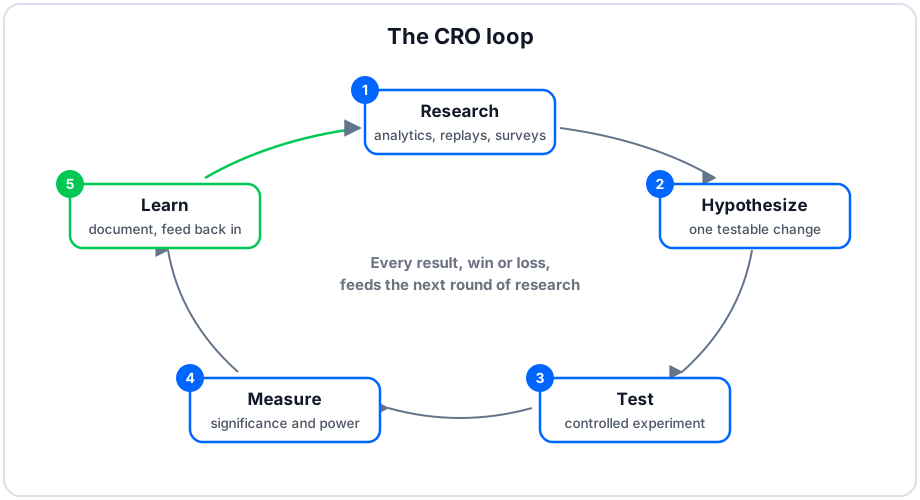
The CRO loop. The discipline is less about any single tactic and more about deciding by evidence, repeatedly.
- "Conversion rate optimization," Wikipedia.
- "A/B testing," Wikipedia.
- "Statistical significance," Wikipedia.
- "Multi-armed bandit," Wikipedia.
- "Freemium," Wikipedia.
- Kohavi, R., Longbotham, R., Sommerfield, D., and Henne, R. "Controlled Experiments on the Web: Survey and Practical Guide." Data Mining and Knowledge Discovery, 2009.
- Kohavi, R., Tang, D., and Xu, Y. Trustworthy Online Controlled Experiments: A Practical Guide to A/B Testing. Cambridge University Press, 2020.
- WordStream, "What's a Good Conversion Rate?" (landing-page conversion analysis, 2014).
- Nielsen Norman Group, published usability research (nngroup.com).
This reference page is maintained by 1Capture, which helps software teams improve free-trial and free-to-paid conversion.